Wildfires today grow increasingly more drastic due to climate extremification. As wildfires grow in size and complexity, crews on the front lines need access to greater situational awareness of fire position relative to themselves for safety. Unmanned aerial systems (UAS) offer an ideal platform to provide such situational awareness, providing an eye in the sky while being relatively cost-effective and portable. Greater levels of autonomy for unmanned aerial systems would make this tool easier to adopt at scale, requiring less training for human pilots and providing greater capability to monitor the environment. While several aerial autonomy works focus on estimating fire position, none seek to perceive fire crew and vehicle assets. In this work WIT-UAS: A Wildland-fire Infrared Thermal Dataset, we develop a dataset for training neural models to detect wildfire crew assets from aerial views. This work was published to IEEE IROS 2023. Read the full paper here.
I contributed to this project as a part of the Wildfire research team at AirLab, advised by Prof Sebastian Scherer. My key contribution to this project are as follows:
- Curated a comprehensive dataset of High-Altitude Wildland Fire Infrared images with crew labels for facilitating the enhancement of wildfire crew detection models.
- Conducted in-depth data analysis on the labeled dataset, generating insightful visualizations to enhance our understanding of the spatial dynamics and patterns associated with wildfire crew assets.
- Tested object detection models like YOLOv3 and SSD on the dataset, running inferences to visualize quantitative and qualitative results.
Data collection and Labelling
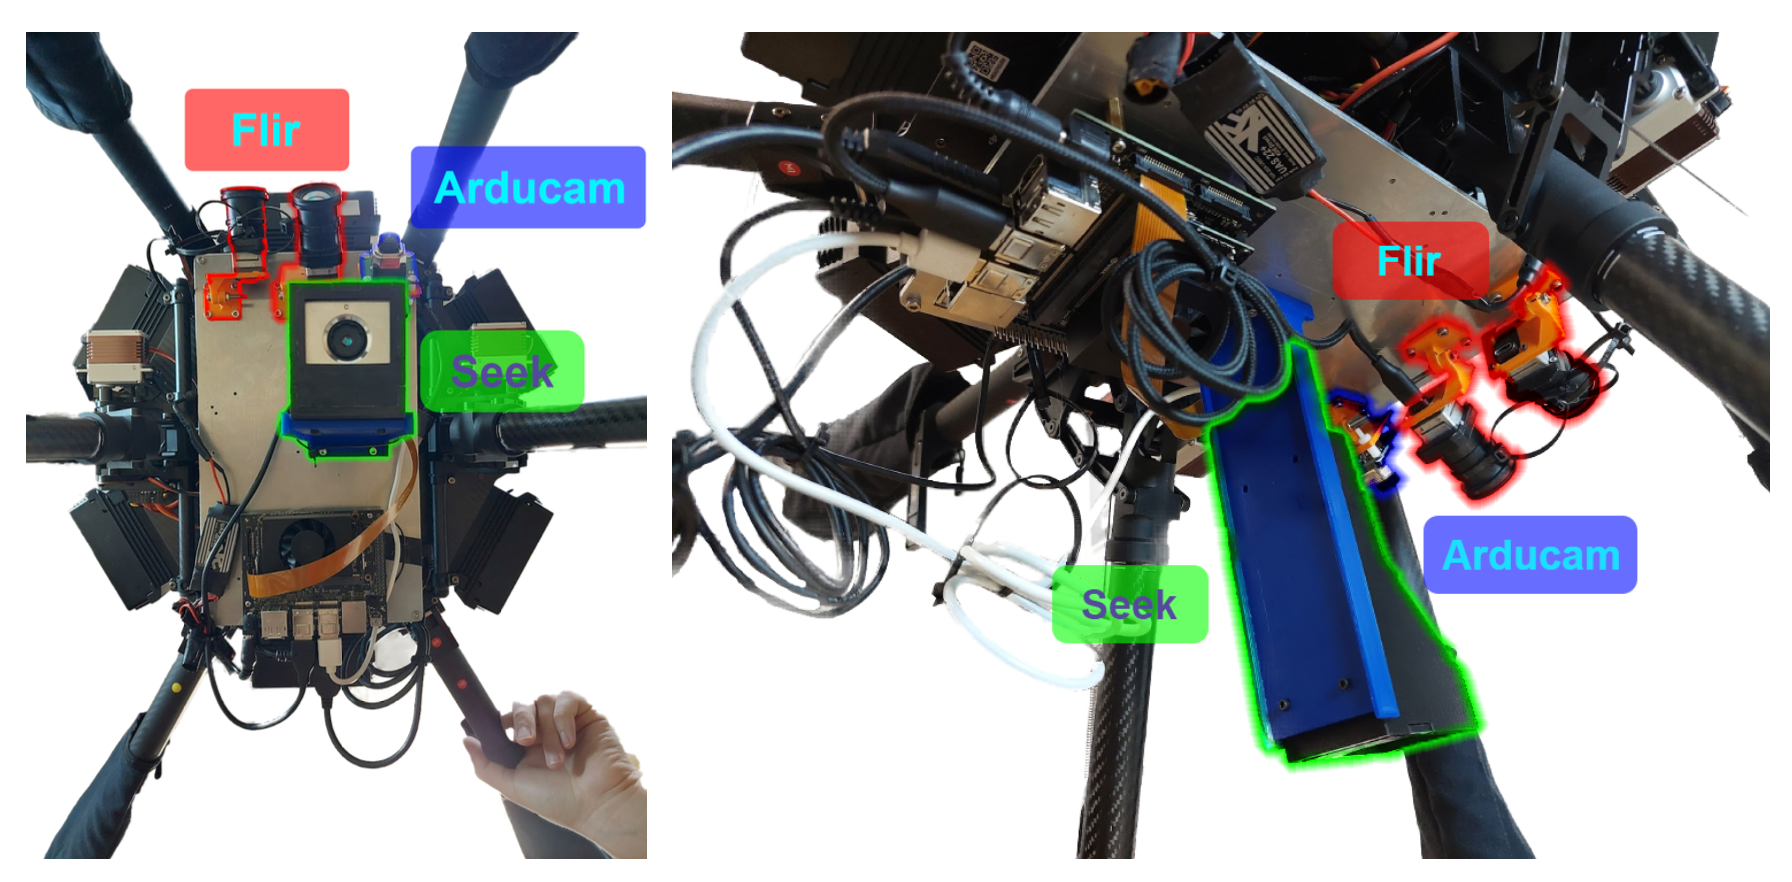
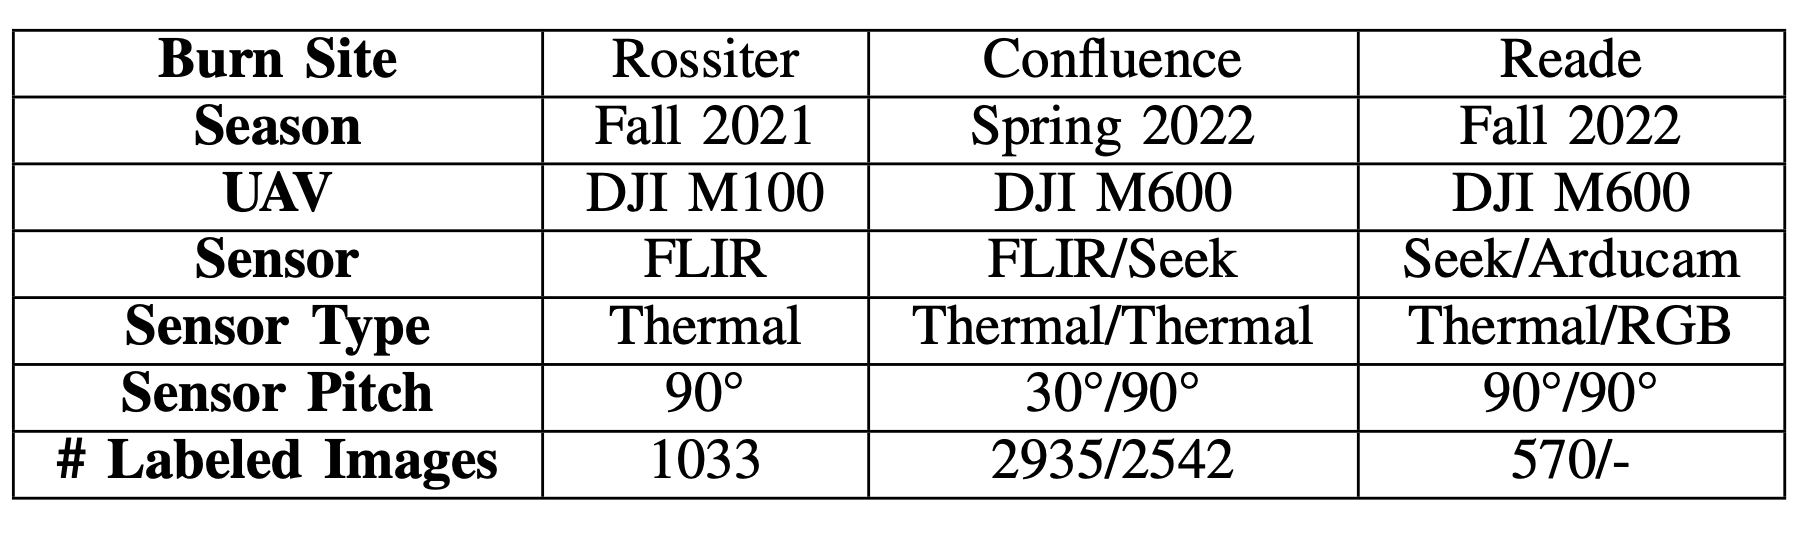
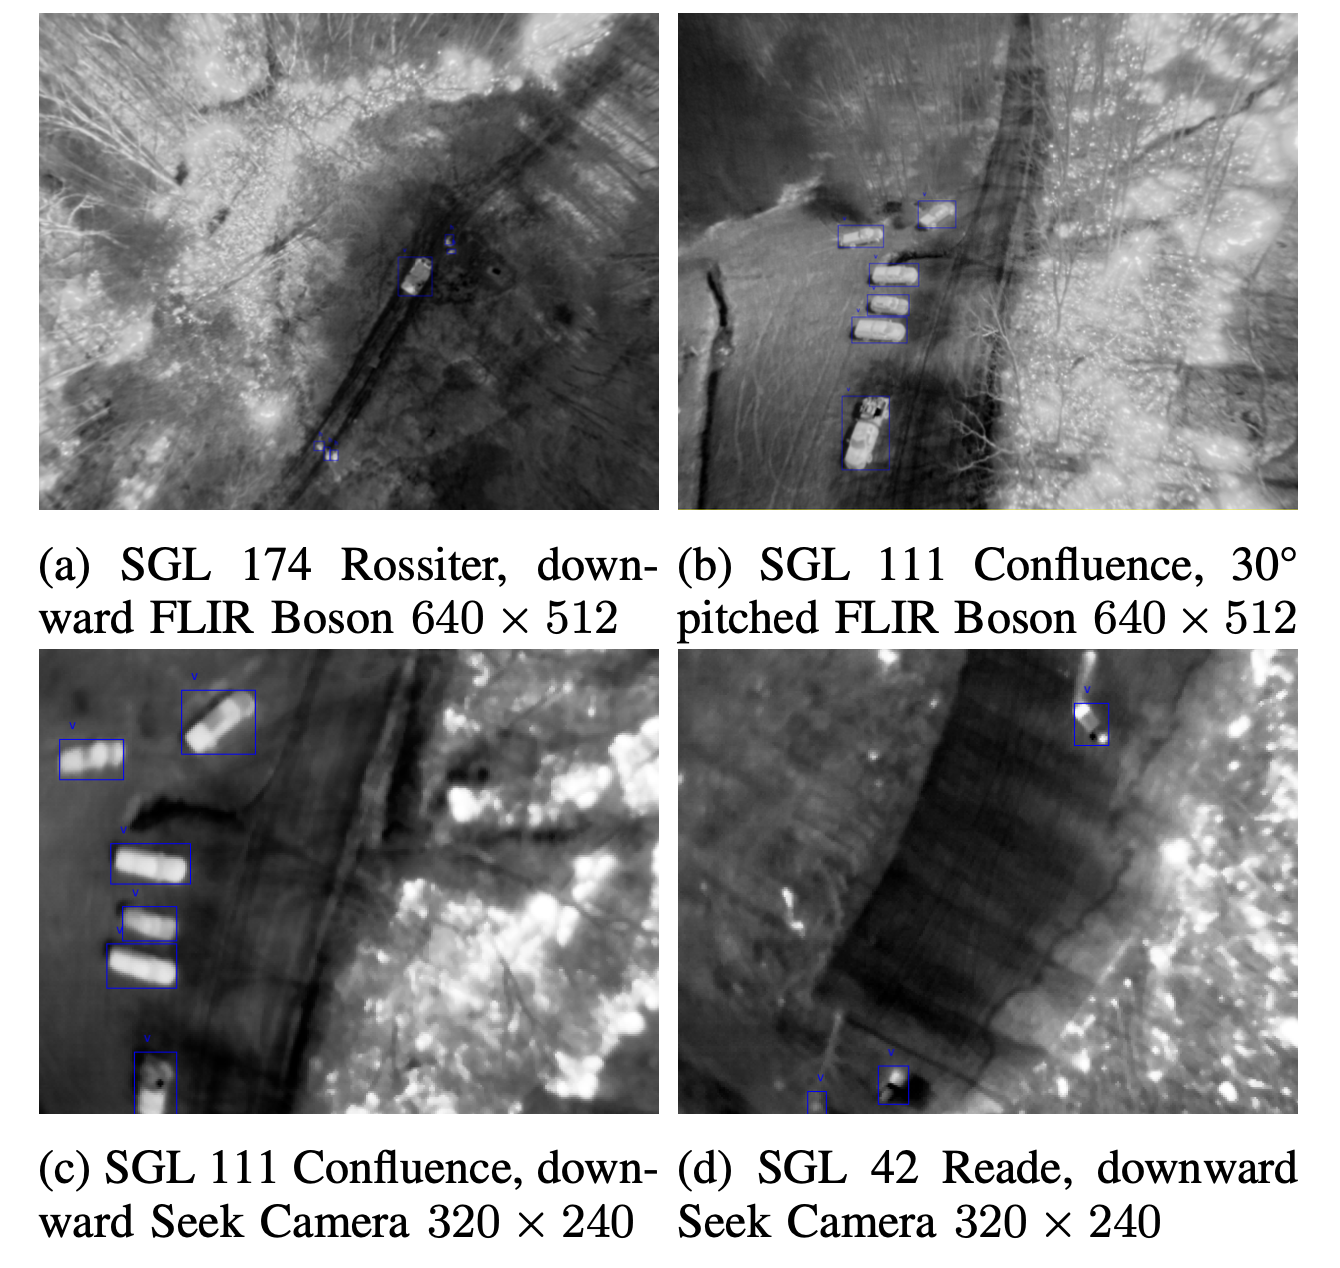
The WIT-UAS-ROS ROS bag files were collected from three prescribed fire seasons (fall 2021, spring 2022 and fall 2022). Prescribed burns were set and managed by the Pennsylvania Game Commission at various State Game Lands (SGL) in Western Pennsylvania, namely (1) SGL 174 near Rossiter, PA, (2) SGL 111 near Confluence, PA, and (3) SGL 42 Reade Township, PA. We worked with the Game Commission to secure a permit to operate UAVs over prescribed fires. The UAV platforms used are the DJI M100 and DJI M600. The DJI M100 was used for SGL 174, whereas the DJI M600 was used for SGL 111 and SGL 42. The UAVs were mounted with an onboard NVIDIA Jetson Xavier NX computer that was connected to the sensors.
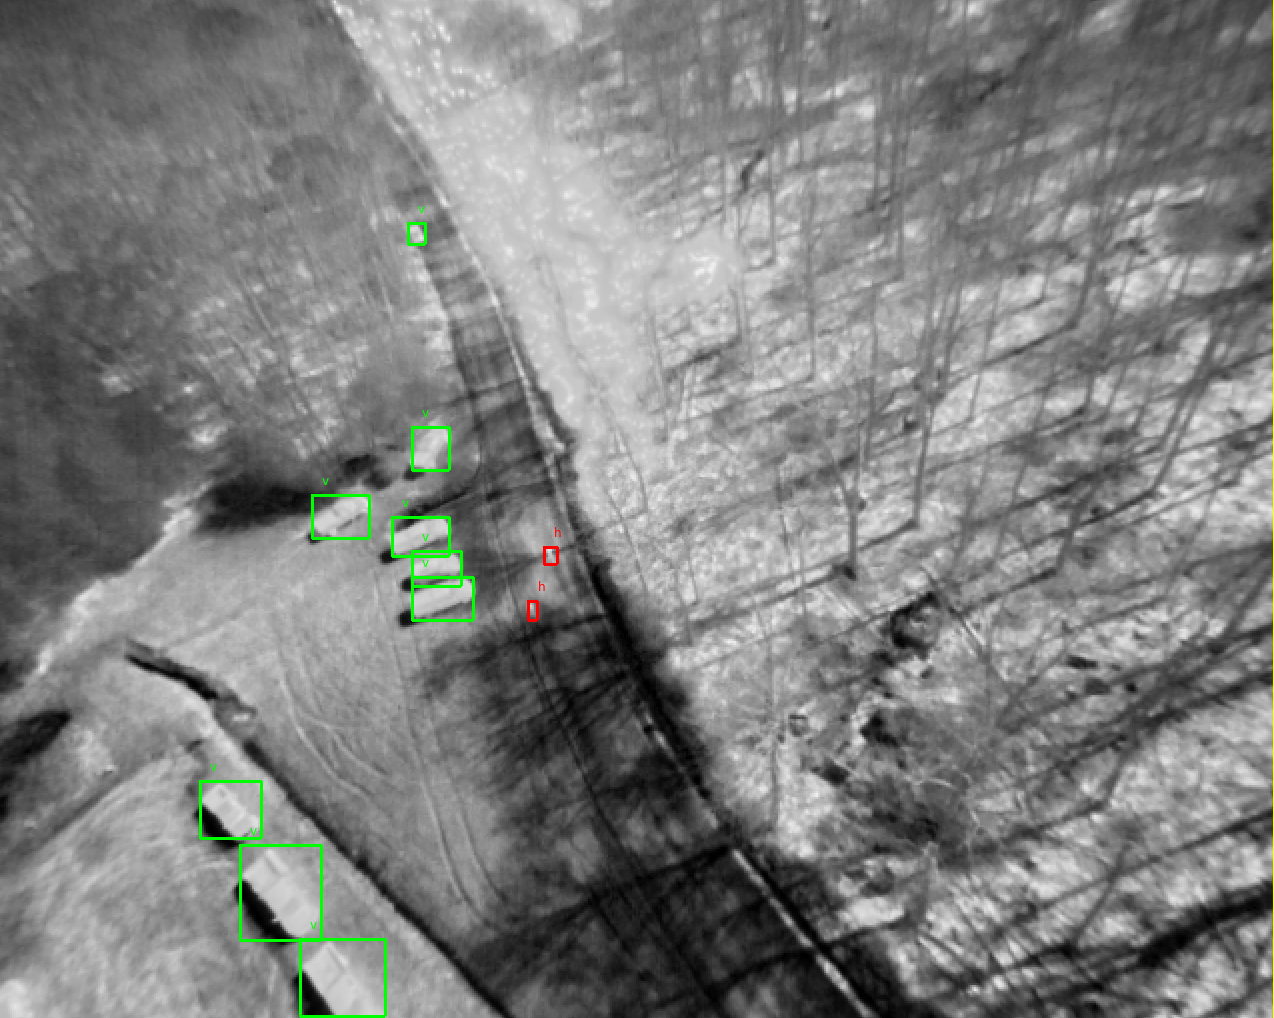
From the recorded ROS bags, we extract images to label at 1 frame per second, resulting in 6951 total images. We labeled the two most important assets of interest to wildland fighters: humans and vehicles. The labelers were either knowledge experts present at the burn site or instructed by such experts on how to properly identify assets. Labelers were instructed to label assets if they could identify them using whatever context cues available; for example, by using contextual knowledge that fire setters would lead the firefront, or to use motion cues from viewing images in sequence.
Data Analysis
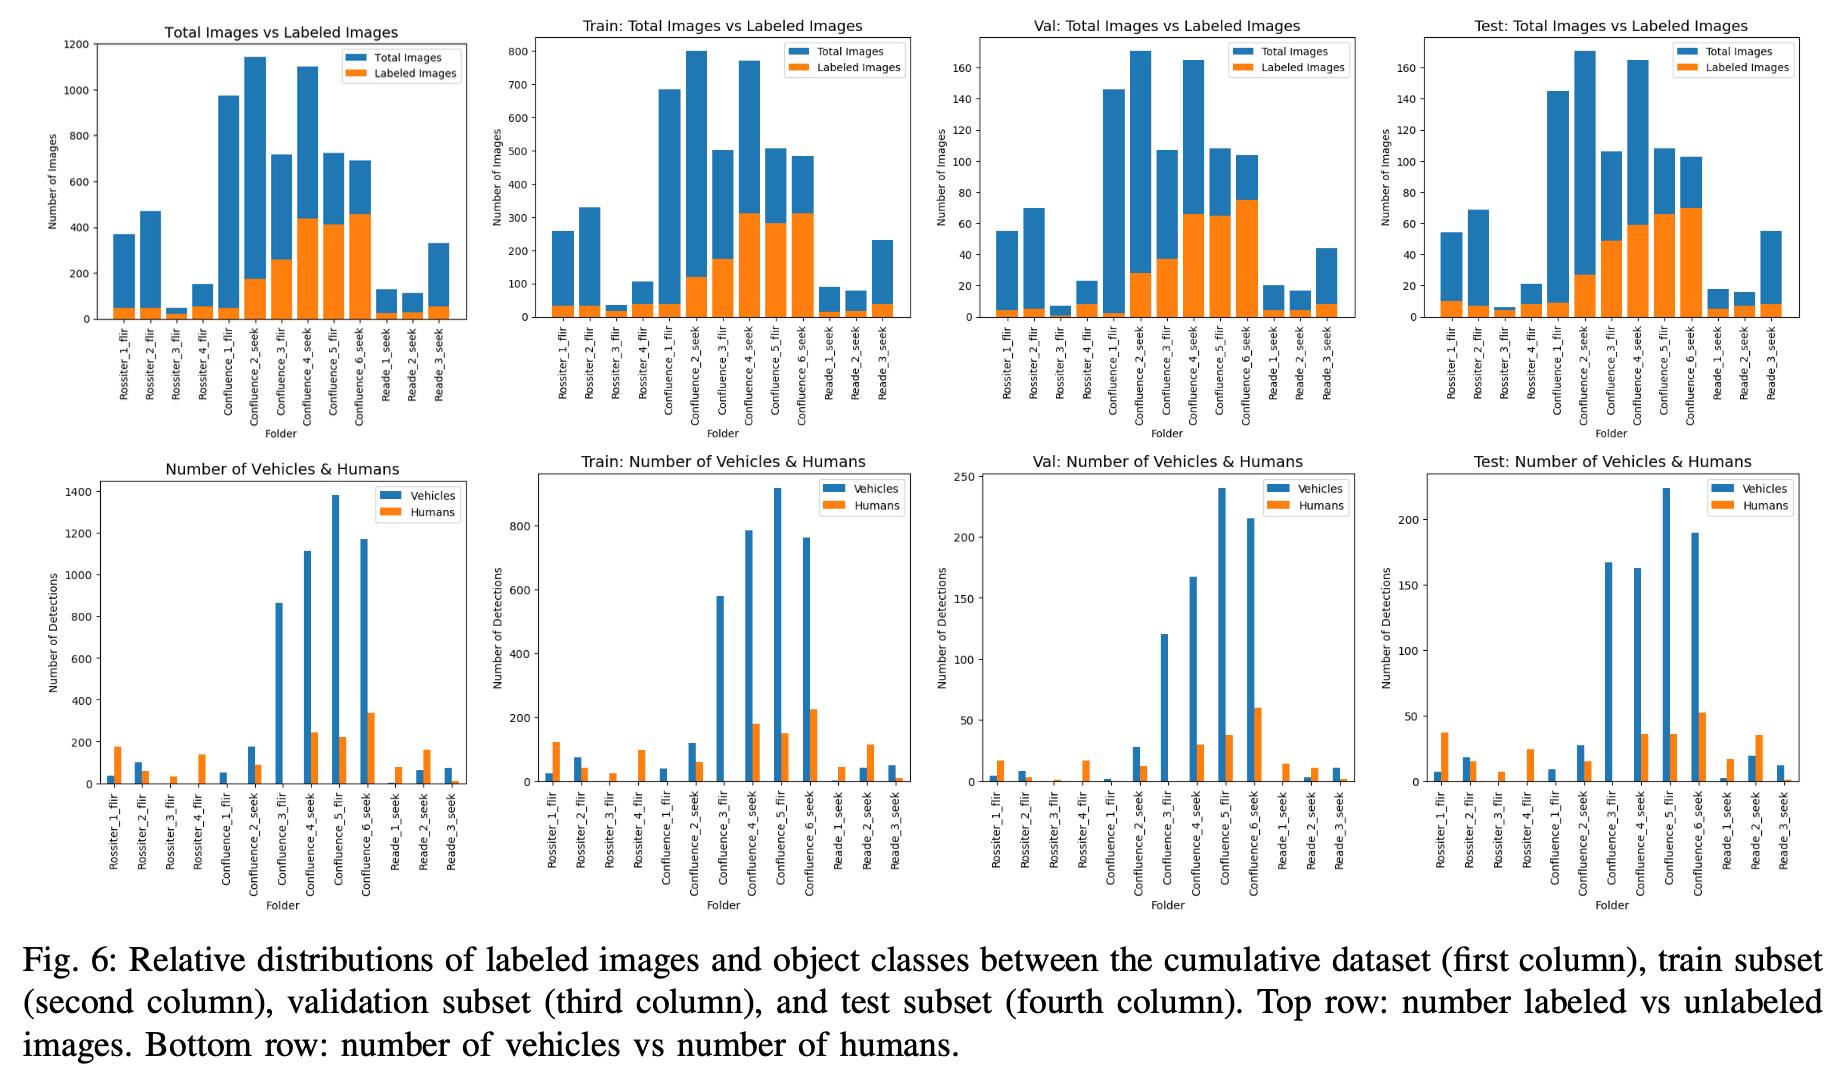
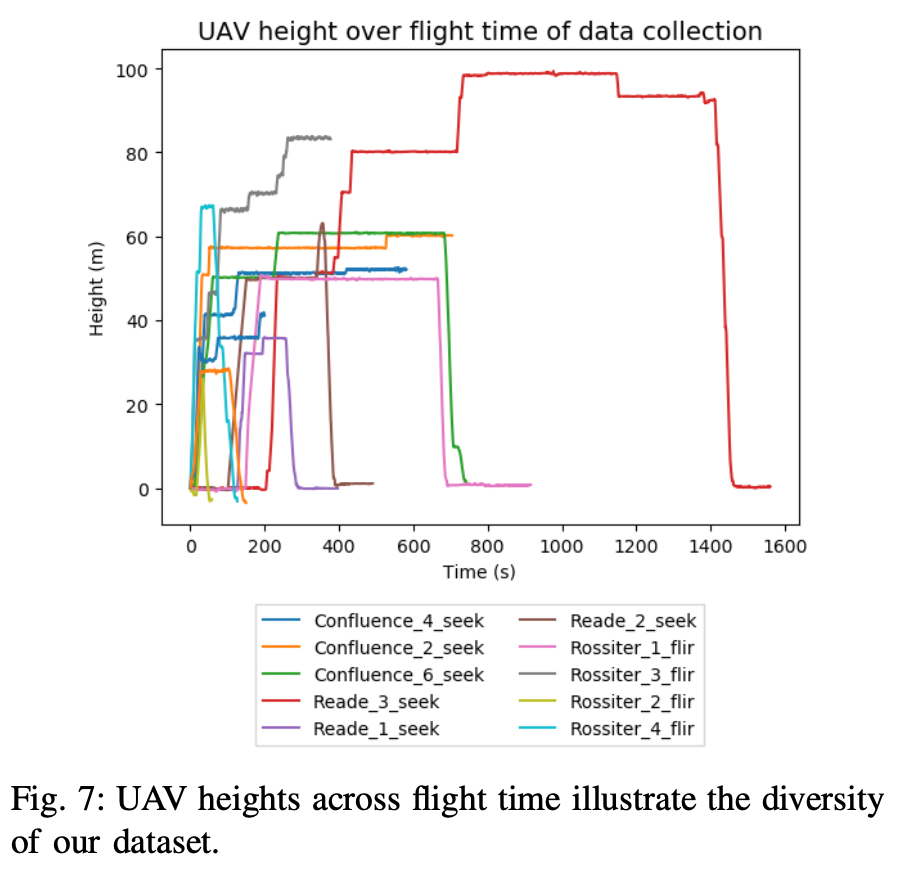
We analyze the Wildland-fire Infrared Thermal (WIT) dataset to illustrate the distribution of identified objects. The dataset comprises a total of 6951 Wildland-fire images. Out of these, 2062 images were manually labeled to identify humans and vehicles. The distribution of labeled images with crew information is illustrated in Figure 6. The annotated dataset includes 5030 labeled vehicles and 1542 labeled human individuals. Figure 6 depicts the distribution of labeled crews across the dataset. The UAVs were flown at various heights ranging from 20 - 100 m. The UAV flight heights were recorded throughout the runs and can be found in the accompanying WIT-UAS-ROS dataset. Figure 7 shows the flying heights for different data collection runs.
YOLO and SSD object detection
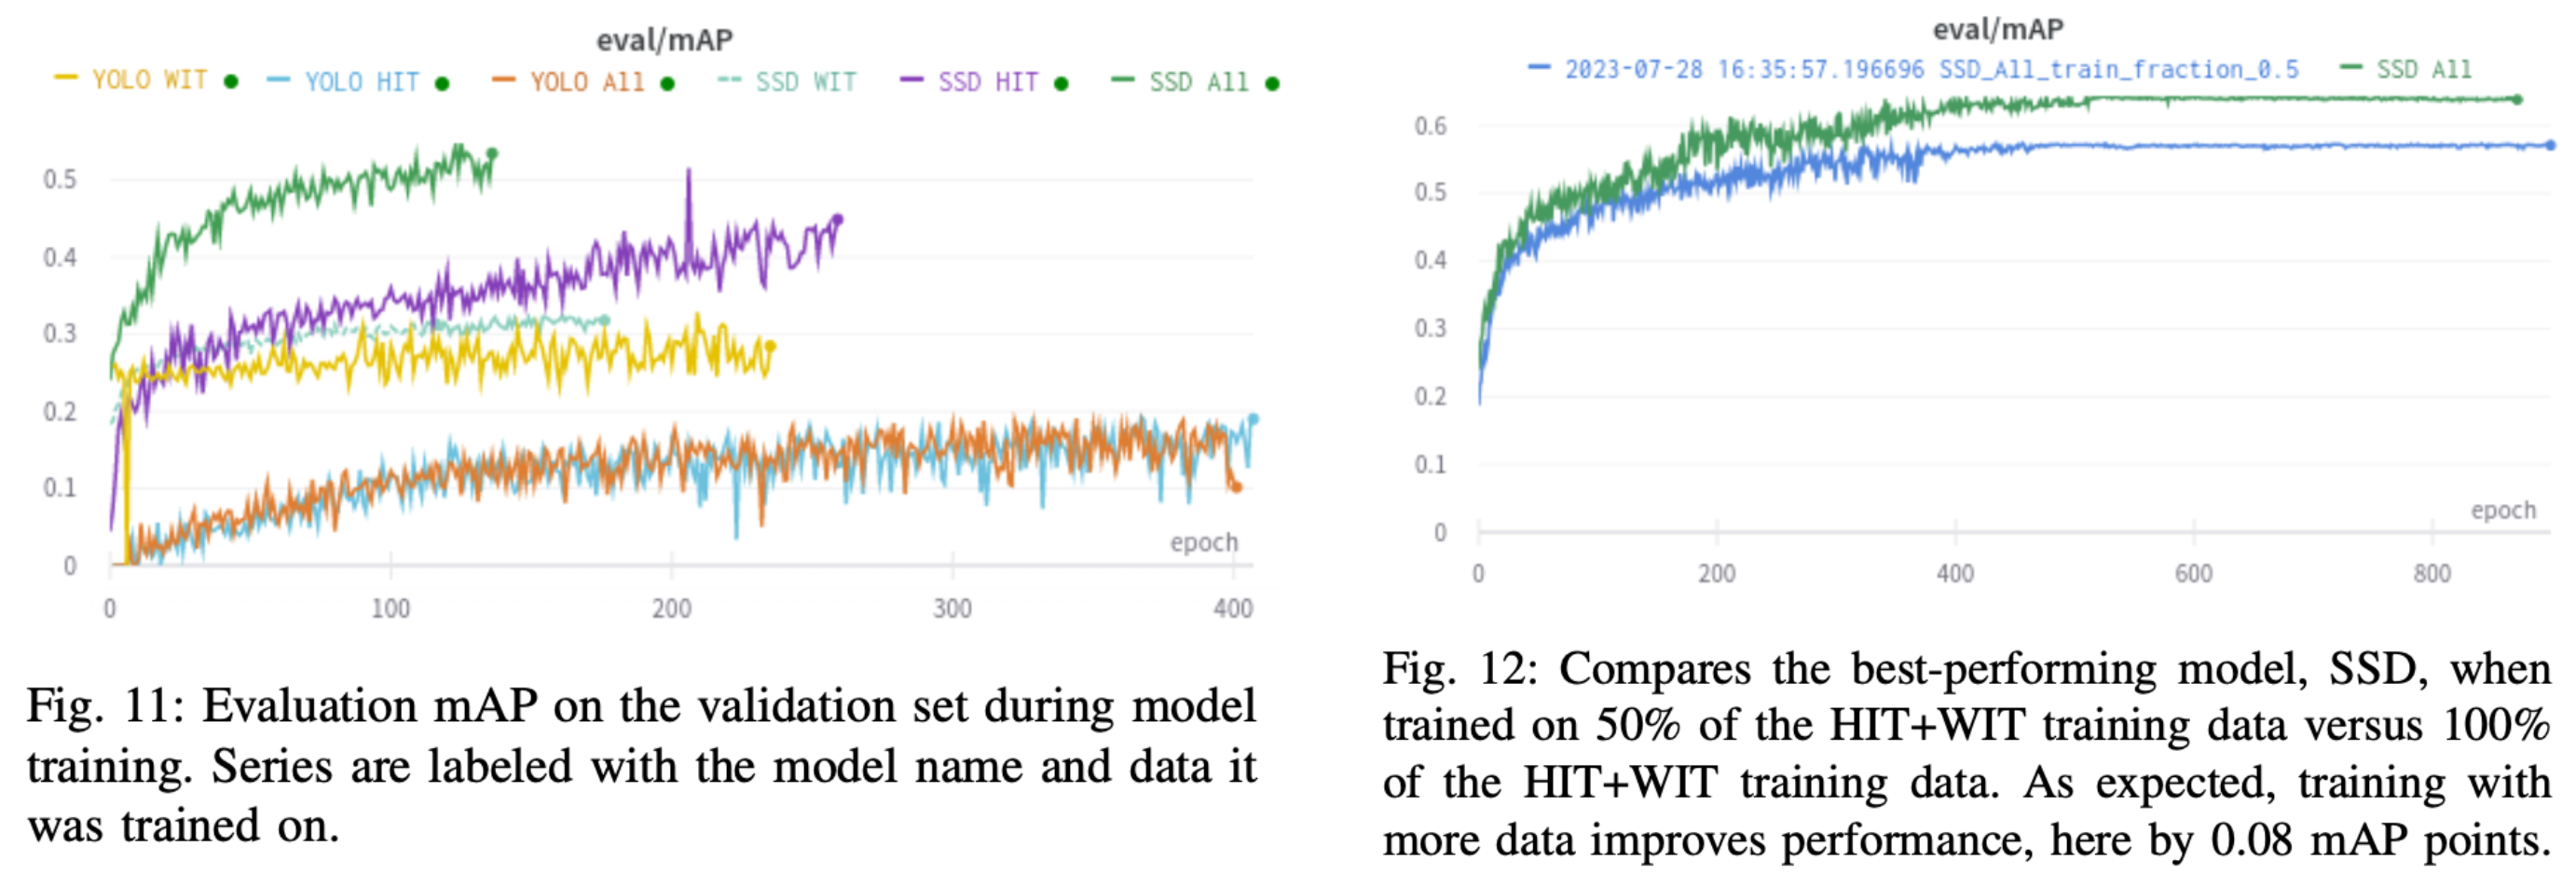
We trained YOLOv3 and SSD300 models on two different datasets: (1) HIT-UAV, an urban thermal dataset, and (2) our WIT-UAS-Image fire dataset. We trained models until they plateaued for a max of 600 epochs. We trained models trained only on HIT, only on WIT, and on both combined. The model is optimized using Adam with learning rates of 0.001 and 0.0005 for YOLOv3 and SSD300. Models were trained with a batch size of 16. Data augmentation included affine and minimal pixel- level transformations. Validation mean average precision graphs are shown in Figure 11. To observe the effect of dataset size on mAP performance, we also compare the best-performing model, SSD300, when trained on only half vs the full amount of the HIT and WIT combined train dataset (Figure 12).
Results
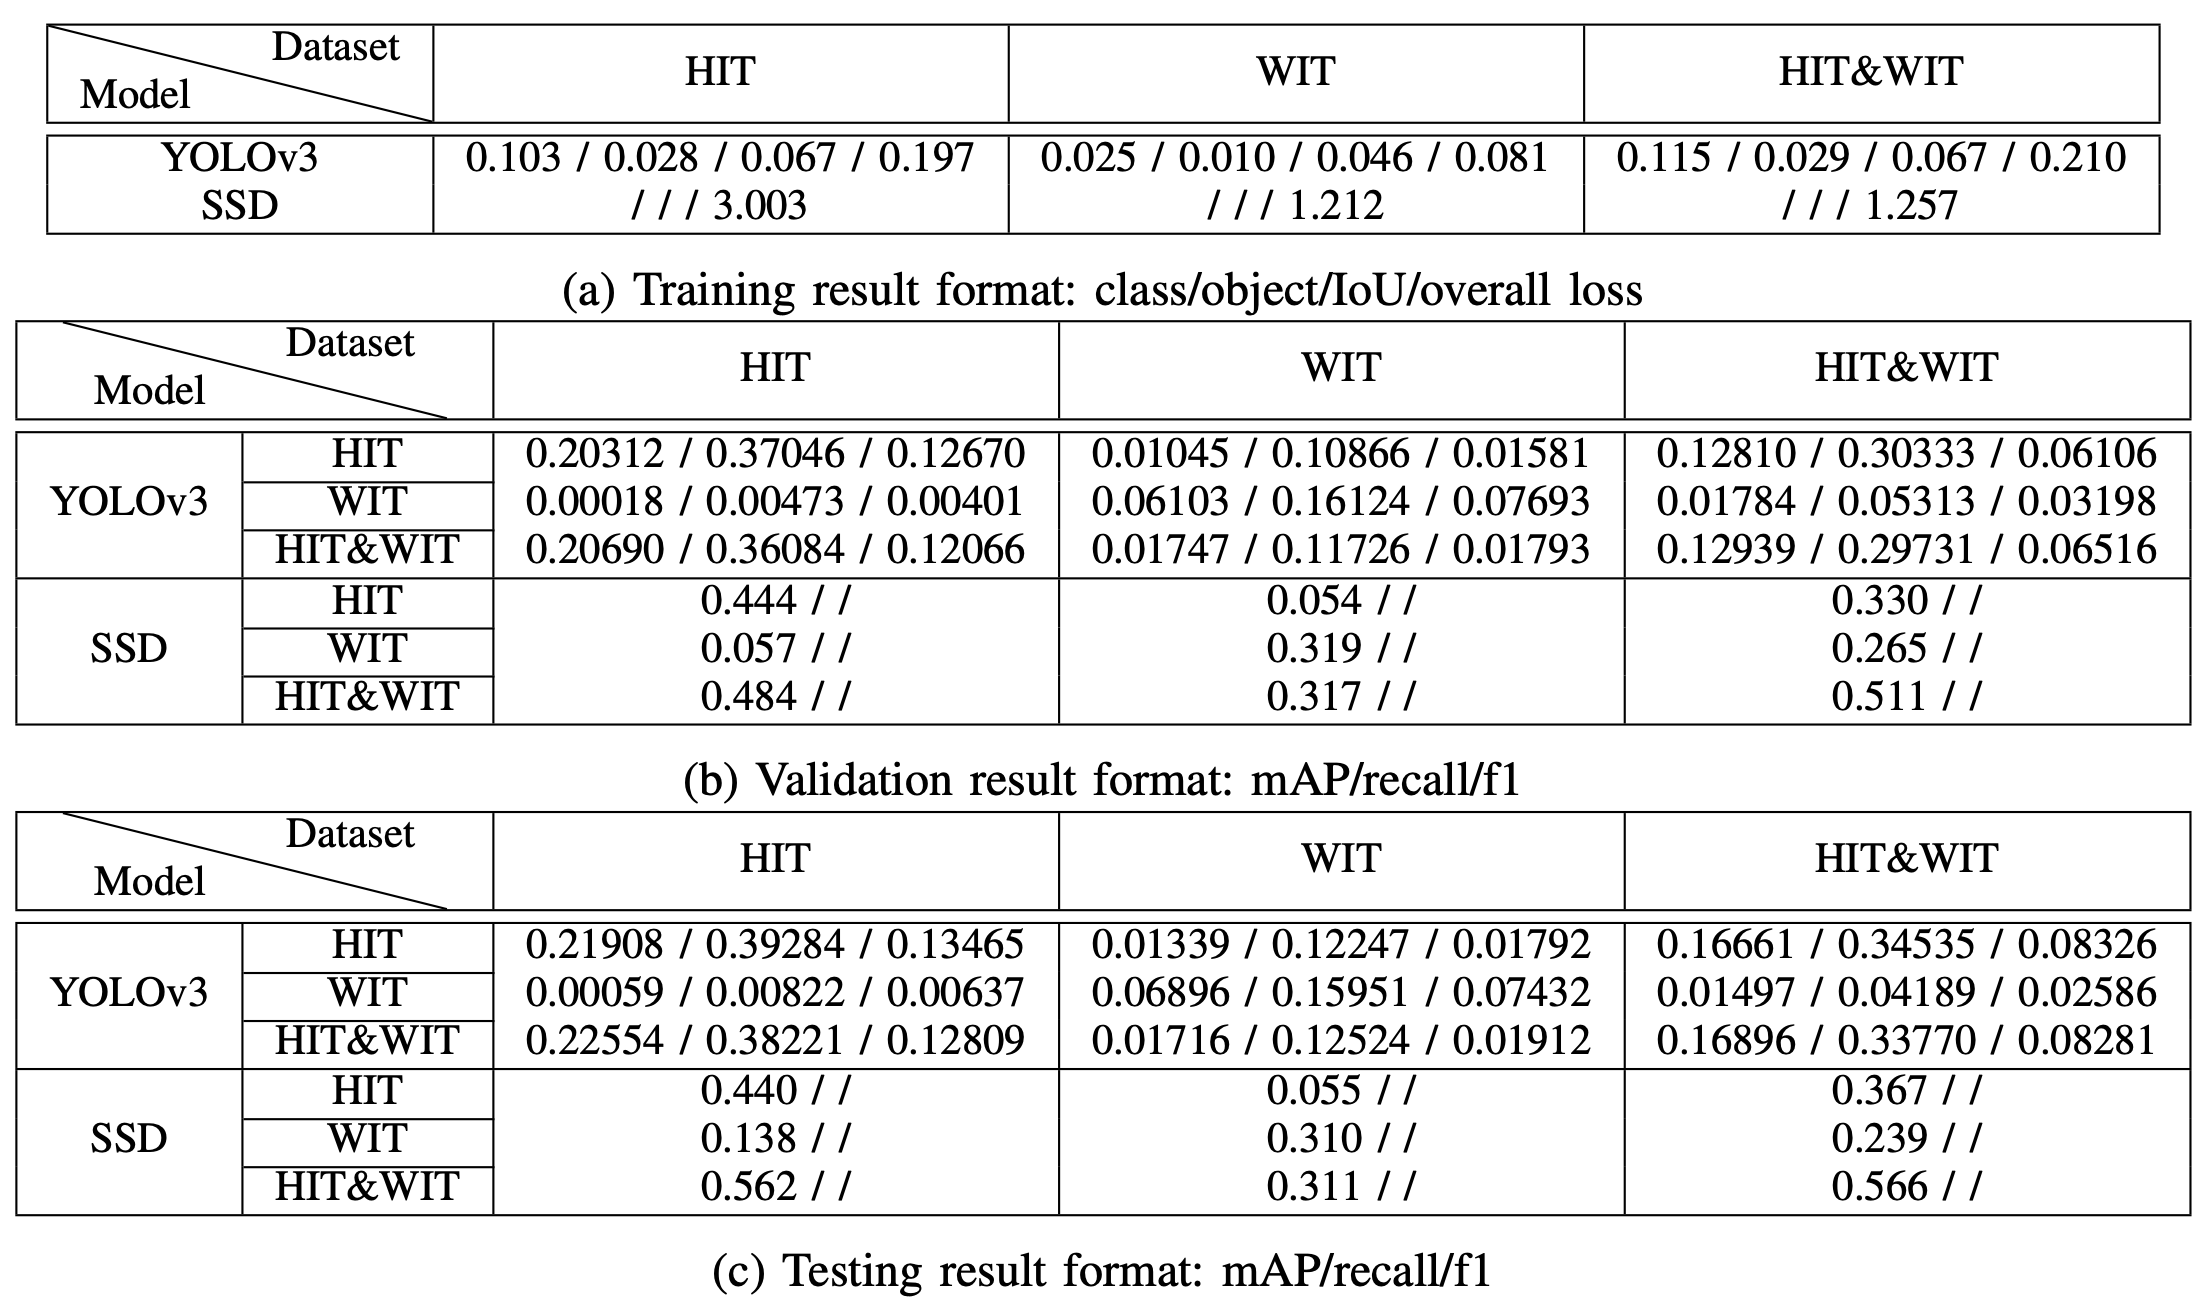
Quantitative Model Results: The results are shown in Table IIb, which produce the following insights:
- YOLOv3 and SSD performed poorly when trained on only one data source but evaluated on the other, i.e. (1) trained on HIT and evaluated on WIT, (2) trained on WIT and evaluated on HIT. This is due to the reason that the WIT-UAS dataset contains thermal images of forests on fire, which is largely different from the urban environment of the HIT-UAV dataset, thus demonstrating a significant discrepancy between distributions of the data in each dataset, which results from the difference in environments where the data is collected.
- YOLOv3 and SSD demonstrate increases in mAP, re- call, and f1 score when trained with both HIT and WIT datasets, albeit marginally. This shows that training with a combined dataset benefits detection, and a demand for more data in the domain of thermal images. Because of the nature of thermal images, objects at far in WIT appear inseparable with small blobs nearby of similar temperatures, which results in similar pixel values and more false positives.
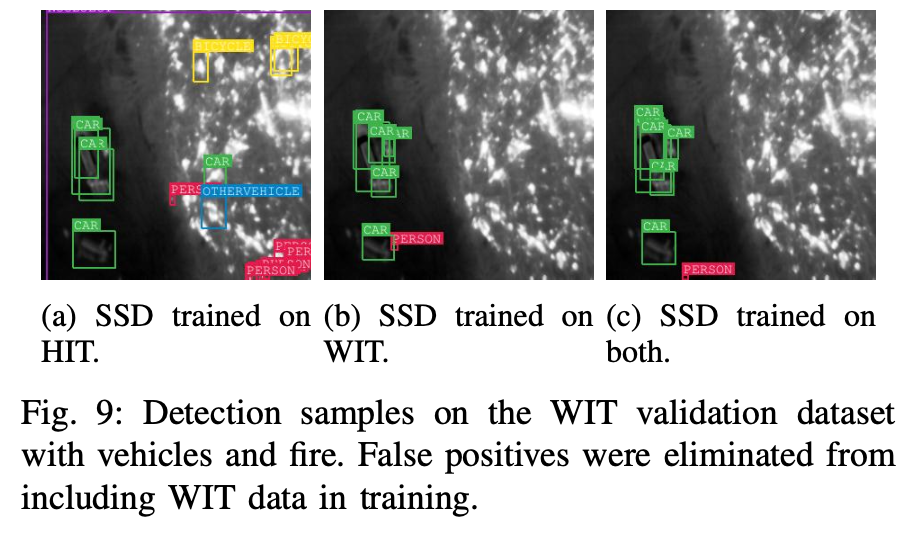
Qualitative Model Results: We visually compare samples from models trained only on urban data (HIT), models trained only on prescribed fire data (WIT), and models trained on both (HIT and WIT). We observe that models trained only on urban data (HIT) but evaluated on wildland fire data (WIT) detected true positives for cars and people, but produced a significantly high number of false positives on the out-of-training-distribution fire data, detecting several fire hot spots as cars and people (Figure 9). We observe that models trained only on fire data (WIT) did not detect false positives in the fire.
Conclusion
Detection of assets of interest in wildland fire scenarios is integral to achieving wildfire safety monitoring. With the introduction of our Wildland-fire Infrared Thermal UAS dataset, we introduce for the first time a fire-environment detection dataset for people and vehicles. We described the composition and uniqueness of our dataset, then trained and evaluated standard neural object detection models upon our data. We showed that training on our dataset quantitatively improved performance on various metrics, and qualitatively reduced the number of false positives. For future work, we recommend more data and more sophisticated models. Gathering more data over prescribed burns in a similar manner to what was presented here would improve performance. While working on this project, I gained hands-on experience of data analysis with python, and training and evaluation of object detection models.